Analytics
Follow how your server grows: joins, leaves, retention, join sources and top inviters.
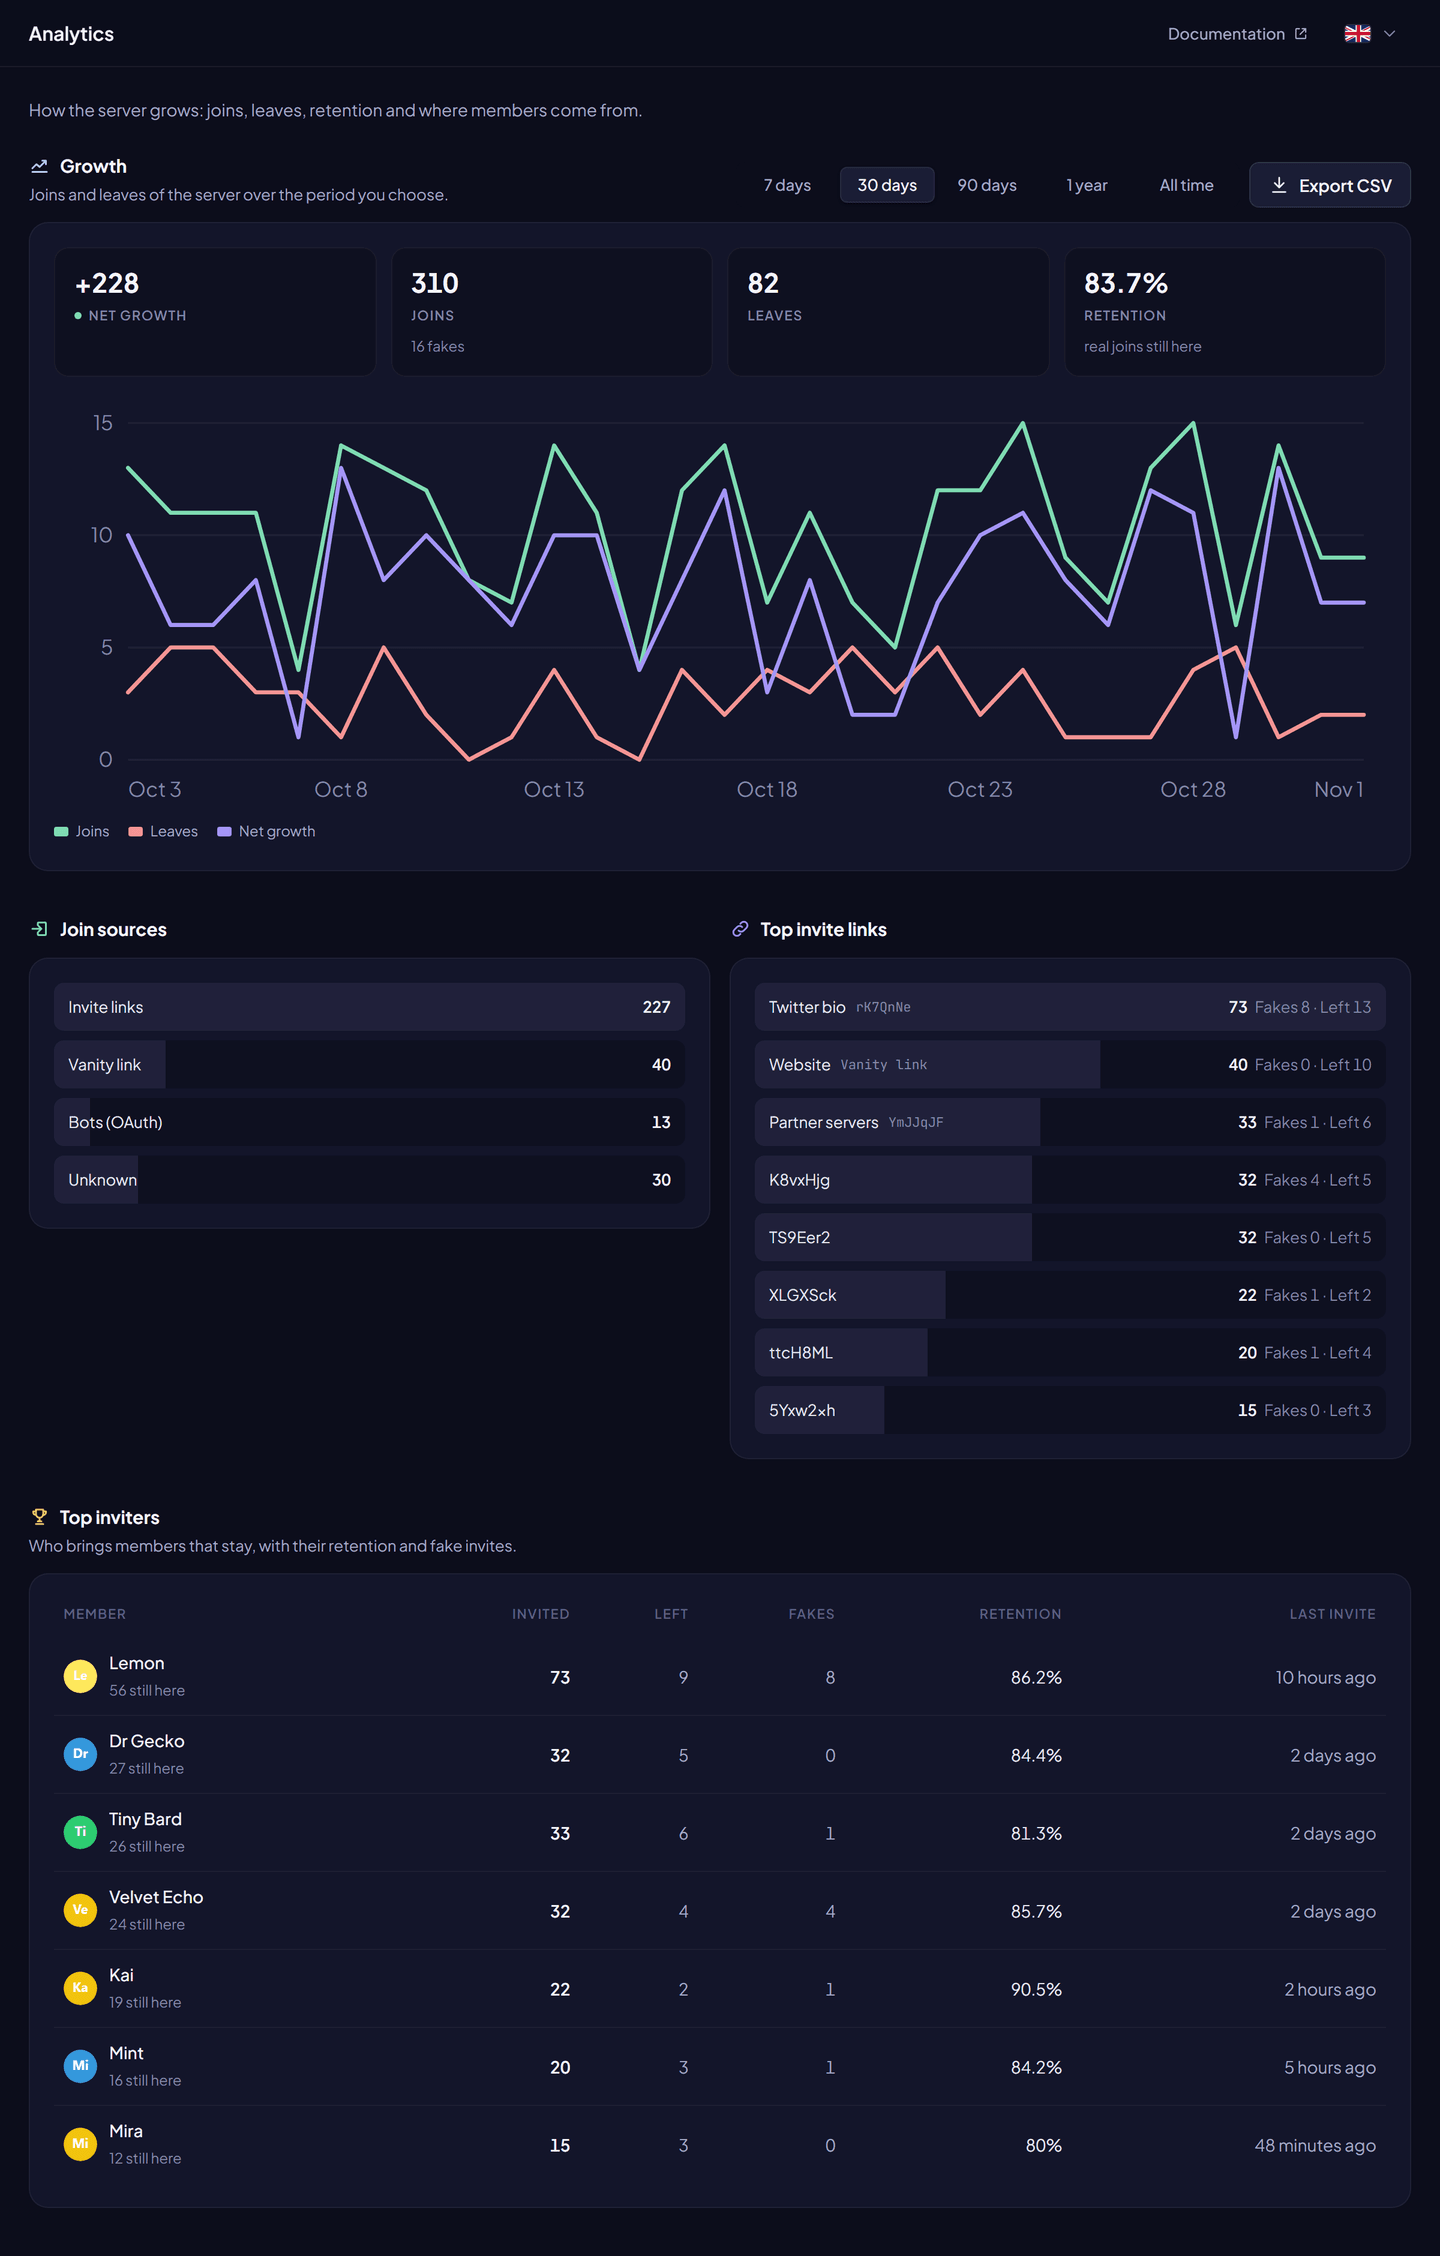
Analytics show how your server grows. The bot records every join and departure with its source, and the dashboard turns them into charts.
Analytics need no setup. They start recording when the bot joins.
What you see#
| Section | Content |
|---|---|
| Growth | Net growth, joins (with fakes), leaves and retention over the period, and a chart of joins, leaves and net growth. |
| Join sources | Joins through invite links, the vanity link, bots added through OAuth, and unknown joins. |
| Top invite links | Invite links by joins over the period, with their labels and how many of those members left. |
| Top inviters (Premium) | Who brings members that stay: members invited, still here, left, fakes and retention. |
- Net growth = joins − leaves.
- Retention = the share of the period's real joins (fakes left out) whose member is still on the server.
Periods#
| Period | Free | Premium |
|---|---|---|
| 7 days, 30 days | ✓ | ✓ |
| 90 days, 1 year, all time | — | ✓ |
Free servers keep 32 days of events; premium servers keep everything.
Export to CSV (Premium)#
The Export button downloads the events of the period as a CSV file: date, type (join or leave), member, inviter, invite code, join source and whether the join was fake. Up to 50,000 events, newest first. One export per minute per server.
Charts in Discord#
/graph joins, /graph leaves and /graph combined draw a daily chart in Discord. days goes from 5 to 90: up to 30 days on free servers, up to 90 on premium servers. You need the View Audit Log permission.
To keep a chart in a channel and refresh it automatically, use Pinned statistics.
Free and Premium#
| Feature | Free | Premium |
|---|---|---|
| Summary, chart, sources, top invite links | 7 and 30 days | Up to all time |
| Top inviters | — | ✓ |
| CSV export | — | 50,000 events per file |
| Events kept | 32 days | No limit |
/graph | Up to 30 days | Up to 90 days |